The Arcades' Lab · Case study 05
Playable prototype · Data experiment
Cultural Weather Vane
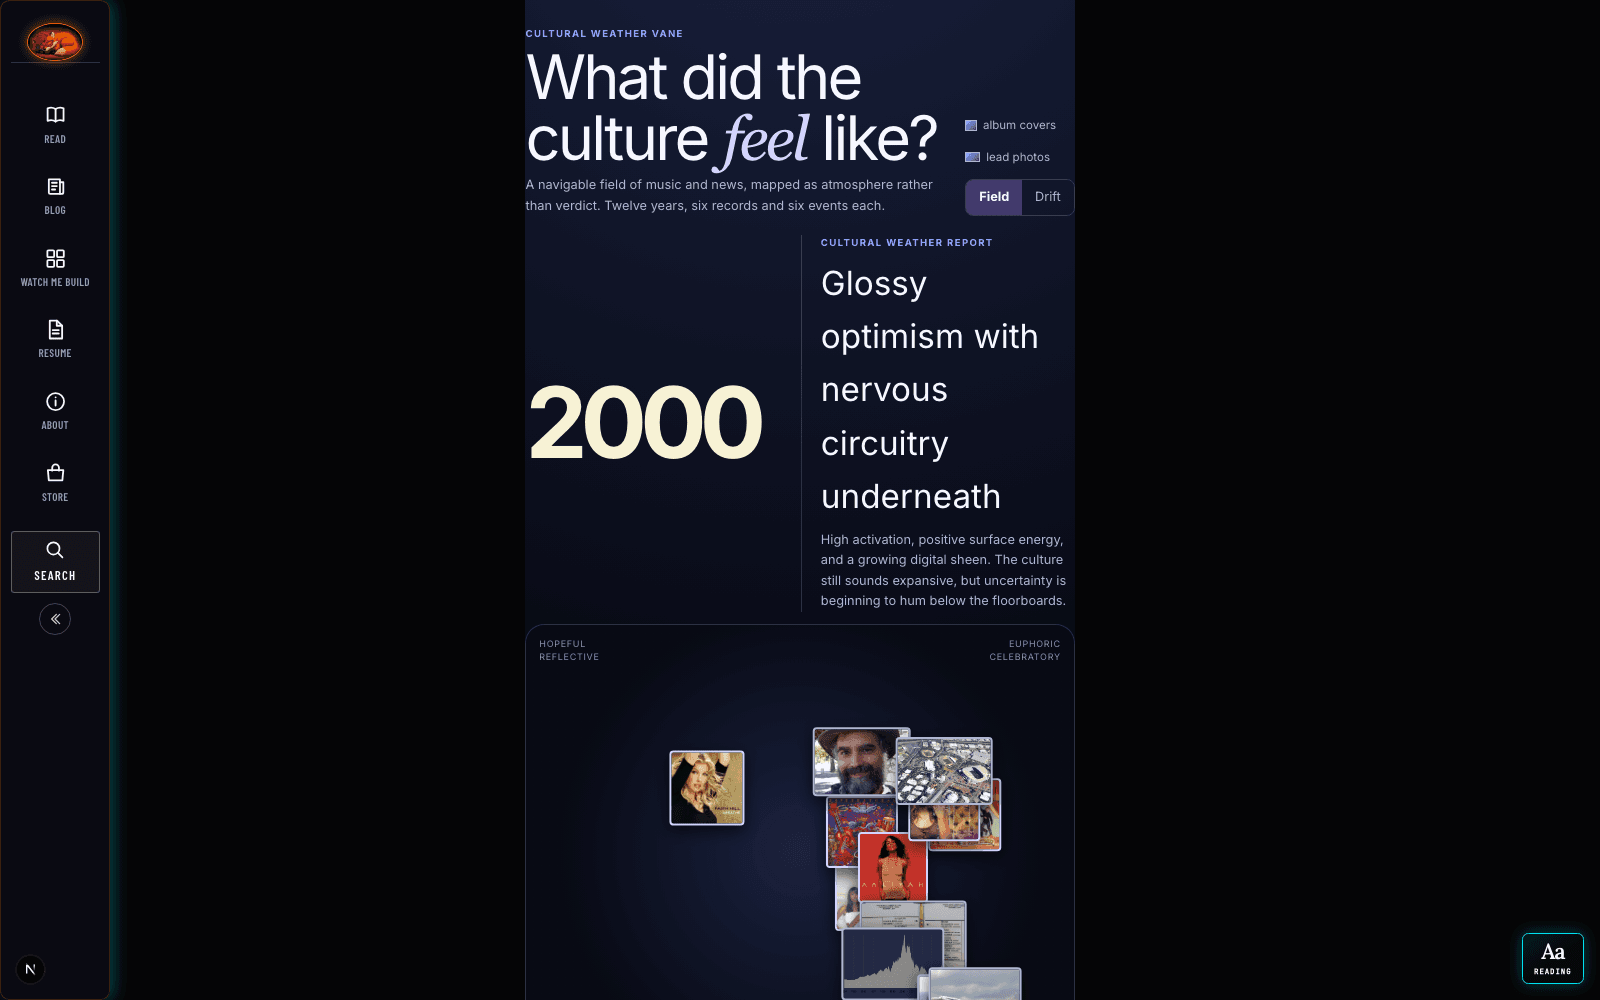
A visual field where music and news share a weather system: plotted, sourced, and explicitly understood as an editorial reading rather than a measurement.
Why I built it
I was listening to Carly Rae Jepsen (CRJ) and Orville Peck and realized they were both being introspective and sad. Then: oh shit, it’s everywhere. Because AI makes ideation easy, I decided to write an app in an afternoon to answer the question: what did the culture feel like?
Cultural Weather Vane puts music and news in the same conceptual field so their atmosphere can be compared without pretending that a feeling is an objective measurement.
Build snapshot
- Field: music and news plotted against activation, valence, and cultural prominence
- Corpus: twelve sampled years from 2000 through 2024, with six songs and six news events per year
- Media: album artwork and Wikipedia page images resolved through a bounded same-origin route
- Modes: a readable Field view and a depth-based Drift view
What I did
I made the comparison visible
The x-axis runs from subdued to kinetic and the y-axis from dark to buoyant. Point size carries prominence; motion carries ambient energy. The two centroids and their divergence line make the relationship legible without collapsing music into a proxy for news.
I kept interpretation honest
The titles and events are real, but the activation, valence, and prominence values are editorial readings. The interface names that boundary instead of laundering judgment into a false precision.
I treated media as evidence with fallbacks
Album artwork comes from Apple’s public search API and news imagery from matching Wikipedia pages. Exact-title and artist matching, bounded requests, source URLs, cache headers, and a labeled SVG fallback keep a missing image from becoming a broken experience or an untraceable claim.
What I learned
Moving from an idea to an interface was fast. Choosing the corpus, axes, scoring, provenance, and honest ways to express uncertainty was the substantive work.
A shared frame is not a causal claim
Putting two fields beside each other invites pattern recognition. It does not prove that one caused the other. The design has to preserve that distinction in its copy and interaction model.
Accessibility changes the visualization
The plotted field is not enough. Keyboard access, a high-contrast media list, readable labels, and a non-canvas route through the points make the work available beyond pointer and vision-first interaction.
Current best
Cultural Weather Vane is a working interactive prototype and a deliberate invitation to look twice: at what culture sounds like, at what the news feels like, and at the distance between those impressions.
Limits and open questions
- The corpus is sampled rather than comprehensive; the next useful expansion is every year with a wider top-25 set.
- The qualitative scores are not survey data or a prediction model.
- Provenance and confidence for every score still need a dedicated layer.
- External album and news images can move or become unavailable, so every item needs a meaningful fallback.
- The field does not claim that music causes the news, that news causes music, or that their visual proximity establishes any causal relationship.
Explore the project
The Toy is the public, playable expression of this case study. Open it to move through the sampled years and inspect the music and news field together.
Cost note: exploring the Toy does not invoke paid AI generation; its media depends on cached public catalog and encyclopedia sources.